Hello, dotAtlas!
This is the developer's manual for dotAtlas version 1.0.0.
dotAtlas is a JavaScript library for interactive exploration of 2d point collections.
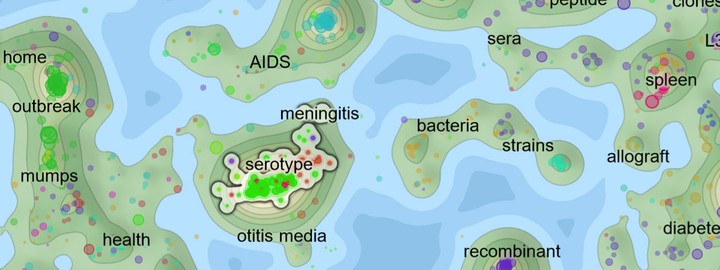
dotAtlas can produce zoomable visualizations similar to the one shown below. They combine various types of layers, such as elevations, markers or labels, to produce an attractive map-like presentation of your data.
To get started with dotAtlas, have a look at:
-
Quick start: setting up your first simple dotAtlas visualization with a minimal amount of code.
-
Guides: in-depth articles covering various aspects of dotAtlas, such as requirements, installation, API overview, defining layers, listening to events and more.
Finally, the API references contain details on all the available options and methods.